Result Files
Contents
- General
- Text-based Output
- Graphical Output
- Gene Structures Mapped to Protein Structures
- History of Intron Gain and Loss Events
- Statistics
| General | Back to top |
The following figures illustrate some of GenePainters output formats and options. All figures were generated with the test data comprising coronin genes as included in the archive gene_painter.zip.
| Text-based Output | Back to top |
Basic intron pattern representations
The basic output format is a plain text file where exons are represented as minus signs and introns as vertical bars (Figure 1A). Using the --spaces option (Figure 1B) shows only introns. A more detailed output including intron phases can be obtained by using the --intron-phase option (Figure 1C). Options --merge and --consensus are applied to all generated output.
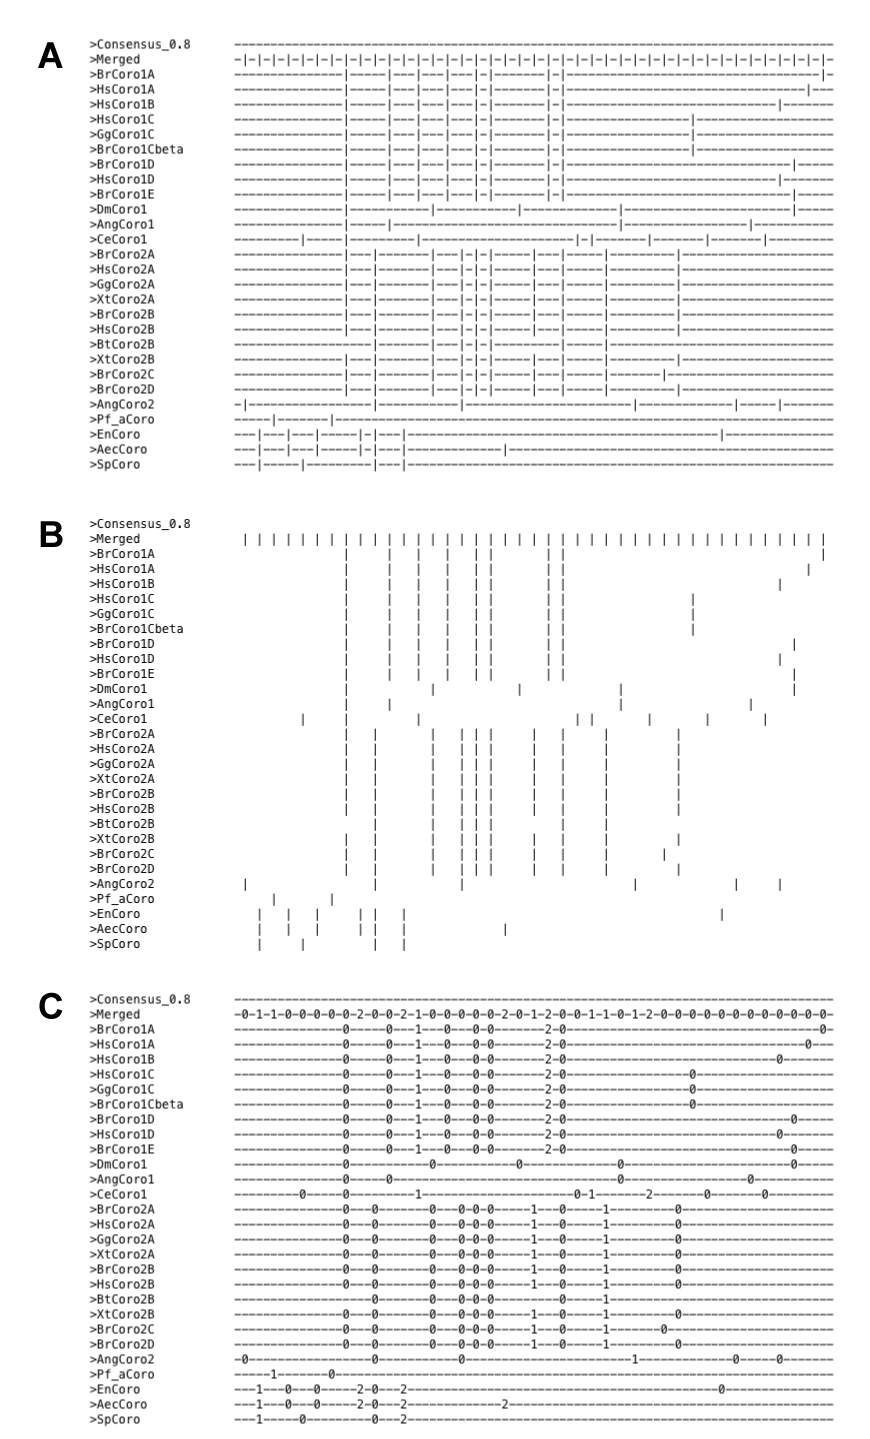
Figure 1 Basic output formats.
In all text based output formats, consecutive introns are by default (or by setting --separate-introns-in-textbased-output) separated by exon placeholders ("-"). By setting the option --no-separate-introns-in-textbased-output, delimiters between consecutive introns are omitted (Figure 2).
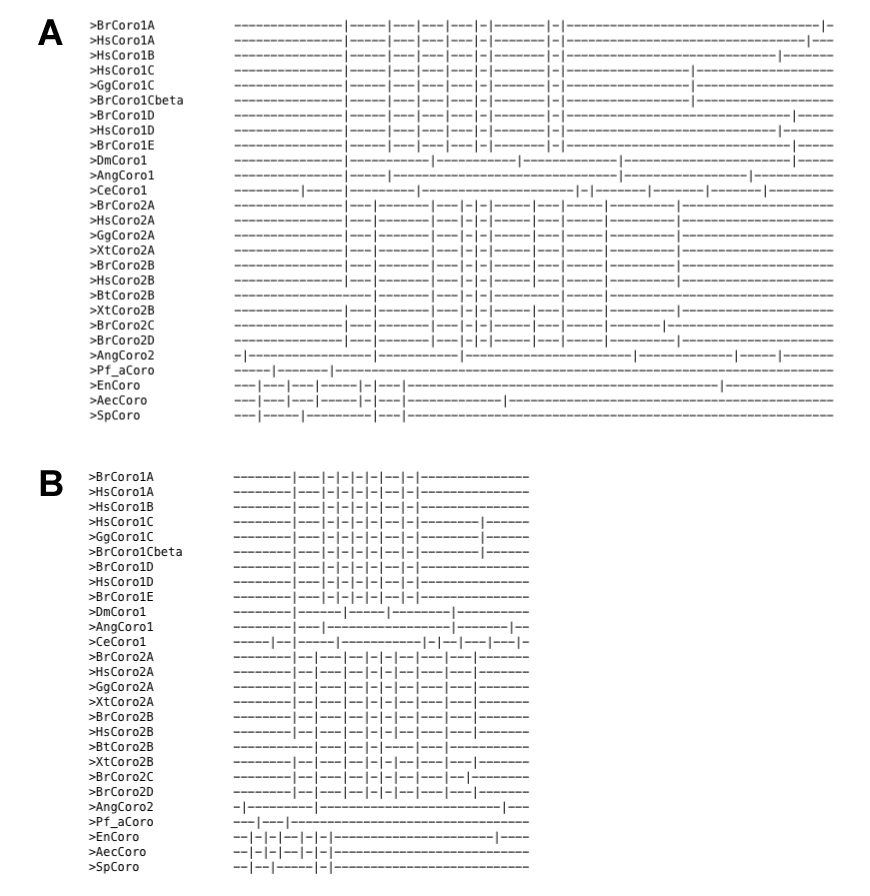
Figure 2 Effect of --no-separate-introns-in-textbased-output
Introns next to alignment gaps
A special case arises when intron positions map between amino acids that are separated by alignment gaps. In this case, the intron could be positioned on both sites of the alignment gap. This becomes relevant when introns are mapped to other sequences in the same region. By default, GenePainter assumes that these regions represent less conserved parts of the proteins as they appear in loop regions, and aligns the intron located in the alignment gap to the first respective intron of the other sequences (Figure 3A).
However, this alignment might be wrong, if the alignment gap is not caused by natural sequence length variation but by a sequence gap caused by e.g. a gap in the respective genome assembly. In this case, the intron alignment can be turned of by setting --no-best-position-intron (Figure 3B).
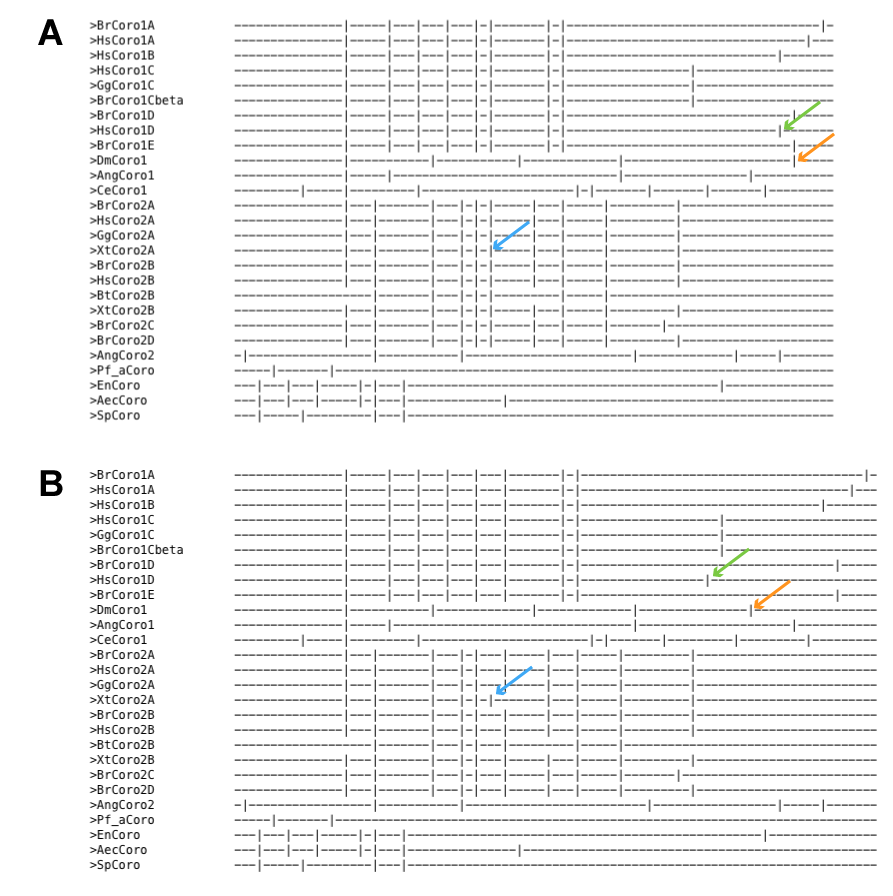
Figure 3 Effect of --no-best-position-intron option.
Enhancing multiple sequence alignments, output for phylogenetic analyses
Moreover, intron phases can be included as additional lines in the given alignment (option --alignment). Common alignment gaps are removed by default. To keep them, use the option -–keep-common-gaps (Figures 4A and 4B). If two or three distinct introns are at the same amino acid alignment position, the will be displayed as "?" instead of listing their intron phase (because of space limitations). Option –-phylo generates an alignment based on the presence (1) and absence (0) of introns for further phylogenetic analyses (Figure 4C).
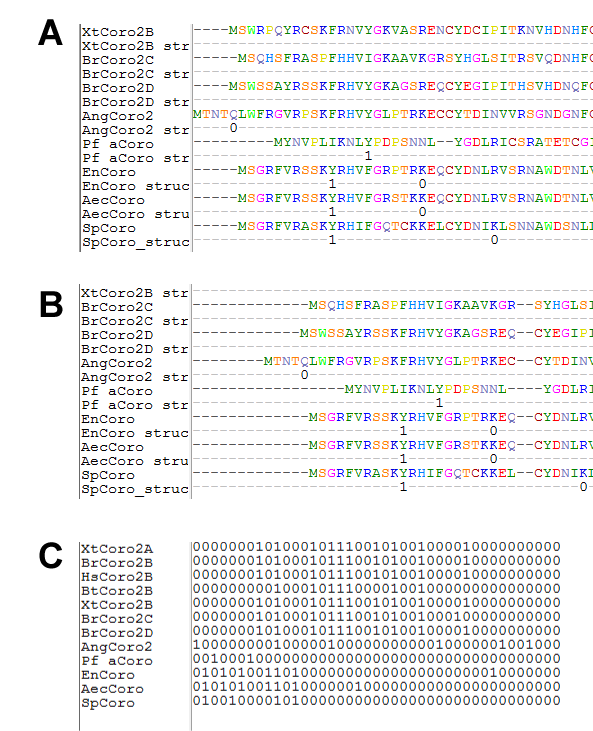
Figure 4 Excerpt of Fasta formatted output formats.
| Graphical Output | Back to top |
Apart from text based output formats, graphical outputs can be generated. To this end, the SVG parameter needs to be set with --svg. The SVG can be drawn in two formats, normal (default) and reduced (set option with -–svg-format). In each format, common introns are drawn underneath each other. While exons and introns are both drawn to scale with format normal (Figure 5A), intron length is fixed within format reduced (Figure 5B). Both formats can be requested at the same time by specifying both.
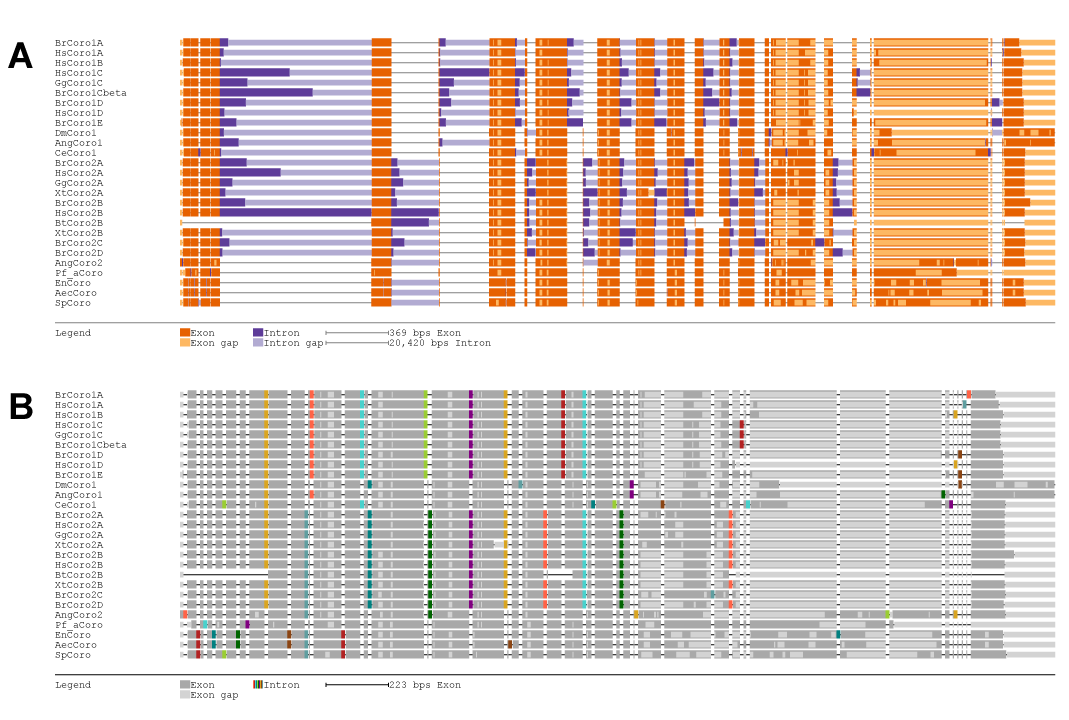
Figure 5 Graphical output options.
| Gene Structures Mapped to Protein Structures | Back to top |
If a pdb file is specified via -–pdb (for example -–pdb example/2Aq5.pdb), intron positions and phases are mapped onto a protein structure. Figure 6A demonstrates mapping of the exons of the human coronin HsCoro1A gene (--pdb-ref-prot HsCoro1A) onto the protein structure of mouse coronin MmCoro1A (the pdb file is part of the test data set). While in this figure all exons present in the reference sequence (--pdb-ref-prot-struct) are considered, Figure 6B displays all exons that are conserved in at least 80% of all proteins (default). Accordingly, splice sites are shown in Figure 6C and Figure 6D. In this output, attention is drawn to intron phases, which are denoted by three colors and numbers, respectively.
Part of the underlying algorithm is the calculation of a global alignment between reference and pdb sequence. The implementation of the Needleman Wunsch algorithm was adapted from Michael Ryan, Copyright (c) 2011 (part of the ruby gem align, downloaded from https://rubygems.org/gems/align).
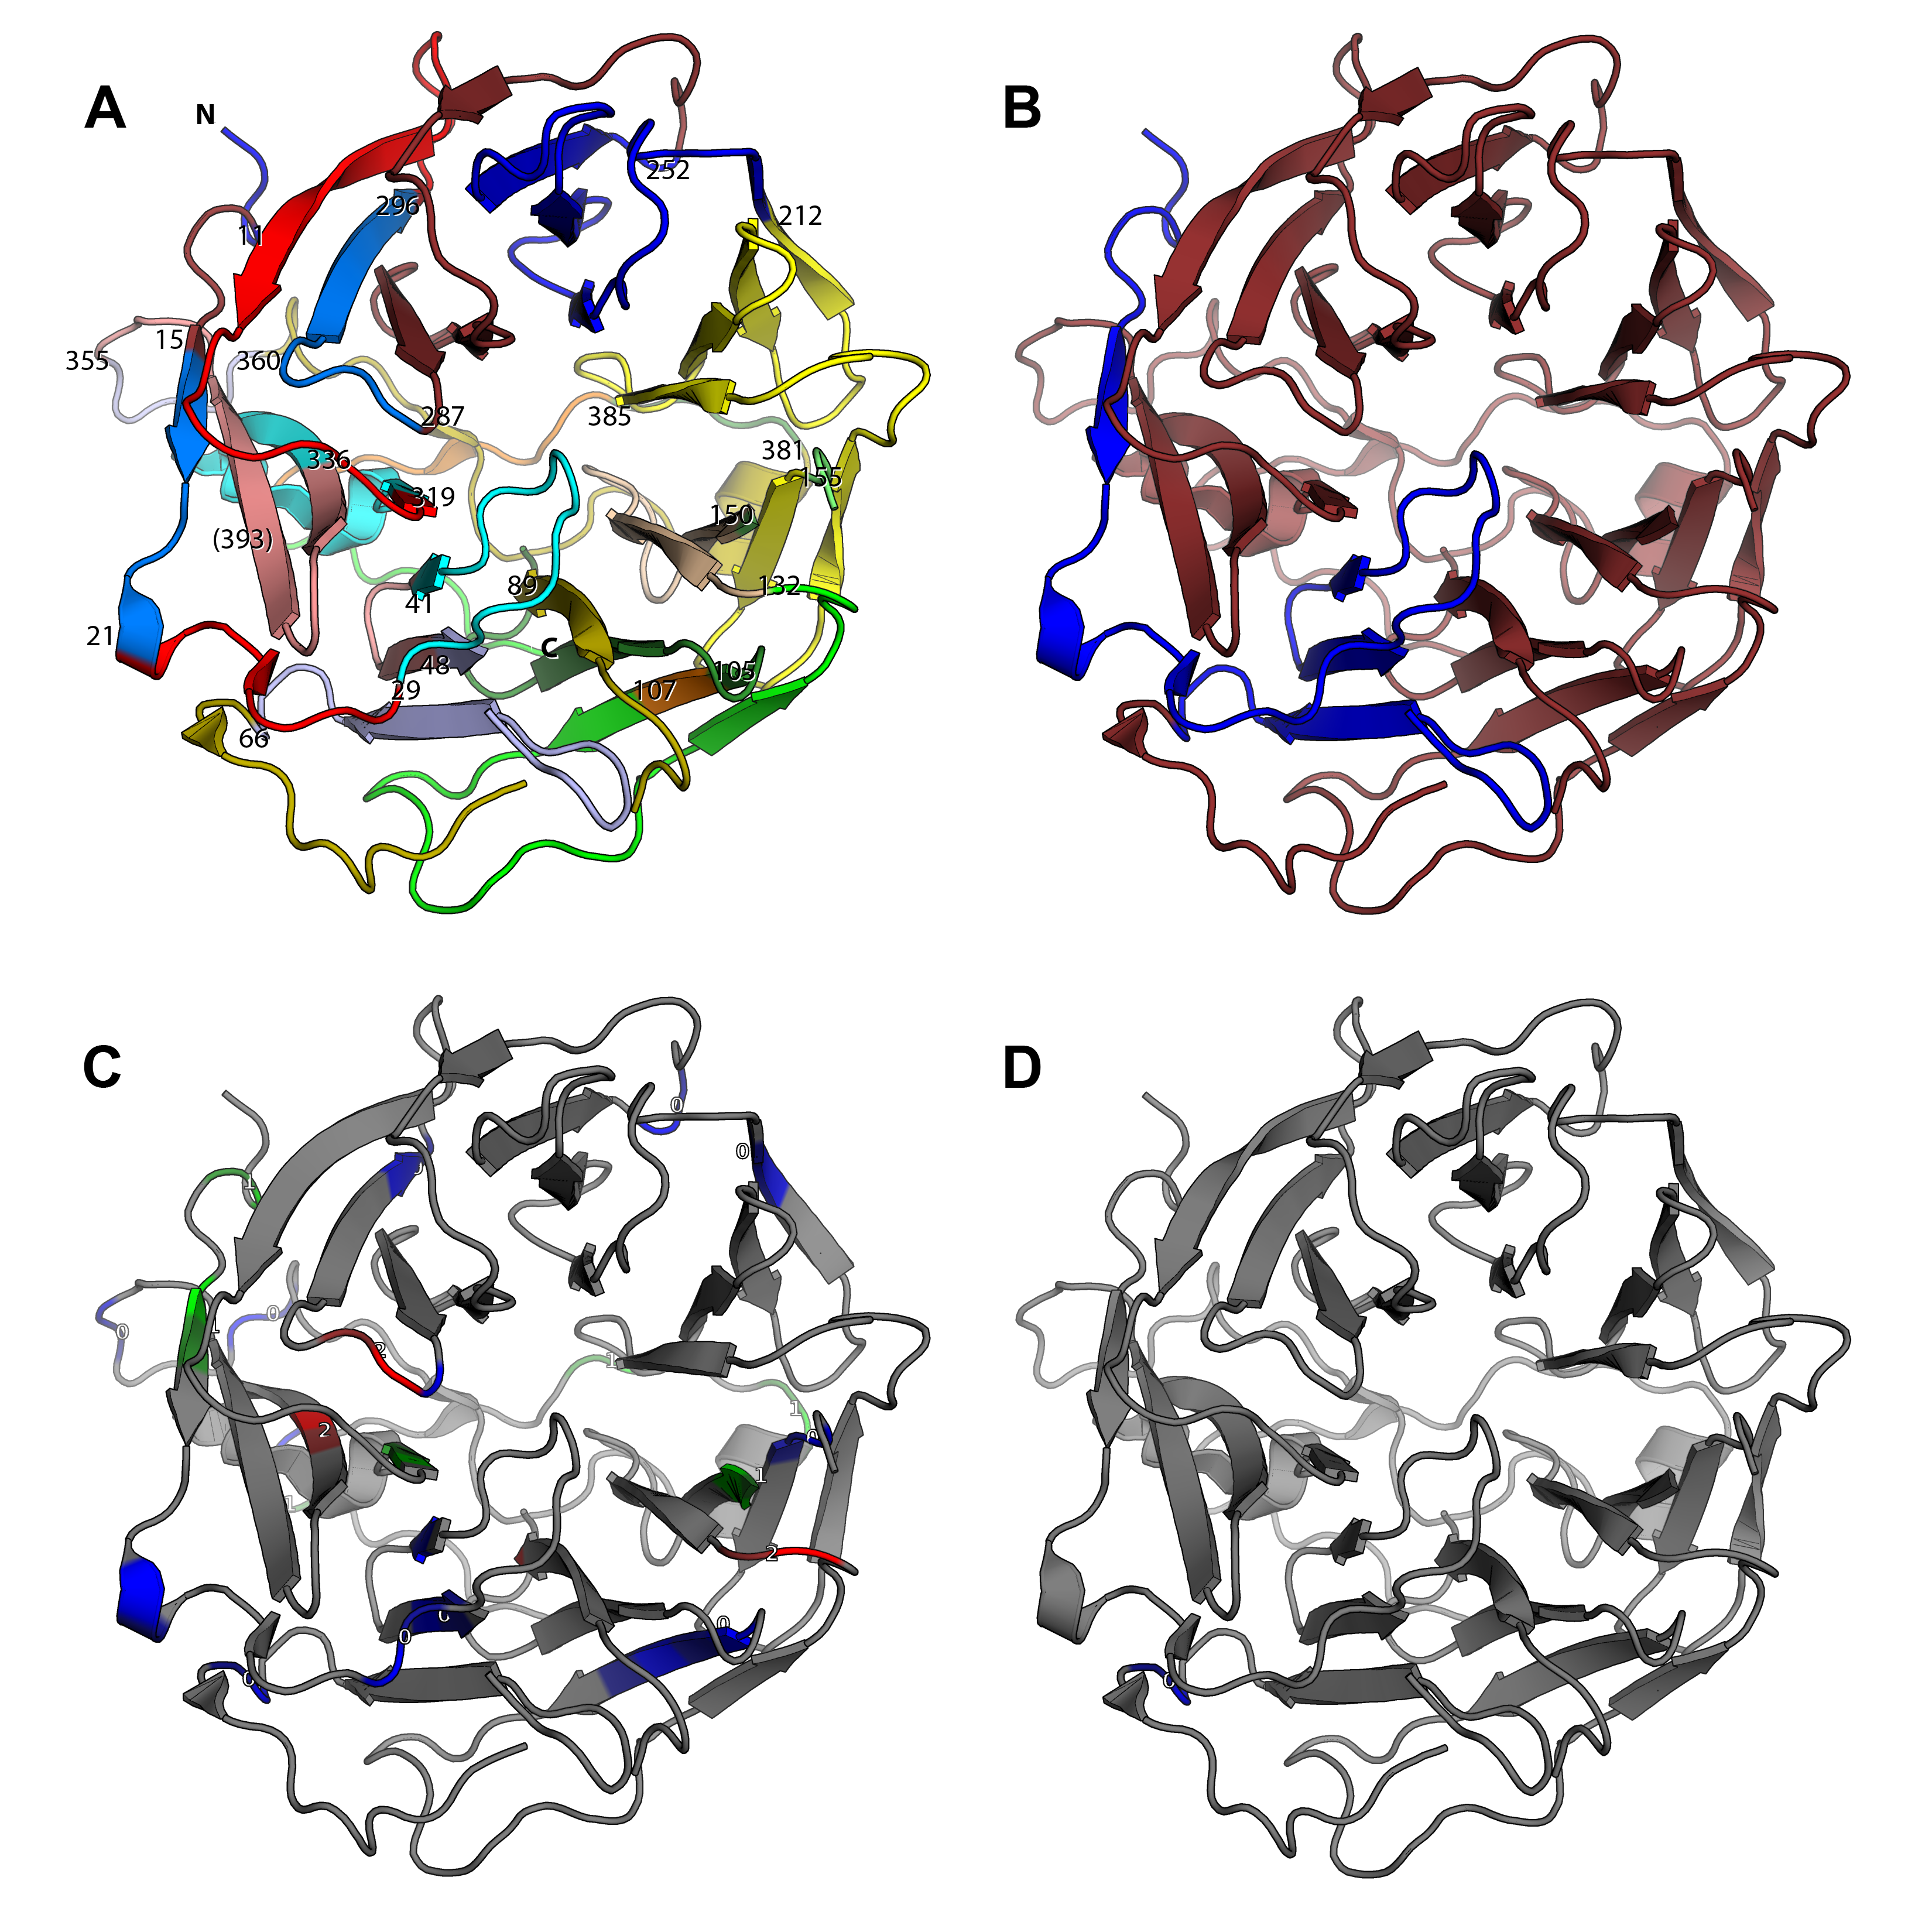
Figure 6 Mapping of conserved exons (A, B) and intron position and phase (C, D) onto protein structure.
| History of Intron Gain and Loss Events | Back to top |
Adding common intron patterns to the standard output
To project intron positions onto the species they occur in, the path to the NCBI taxonomy database dump as well as the mapping between fasta headers and NCBI species names must be specified with parameters --taxonomy and --taxonomy-to-fasta. In addition, one of the taxonomic output formats needs to be specified: Option --taxonomy-common-to
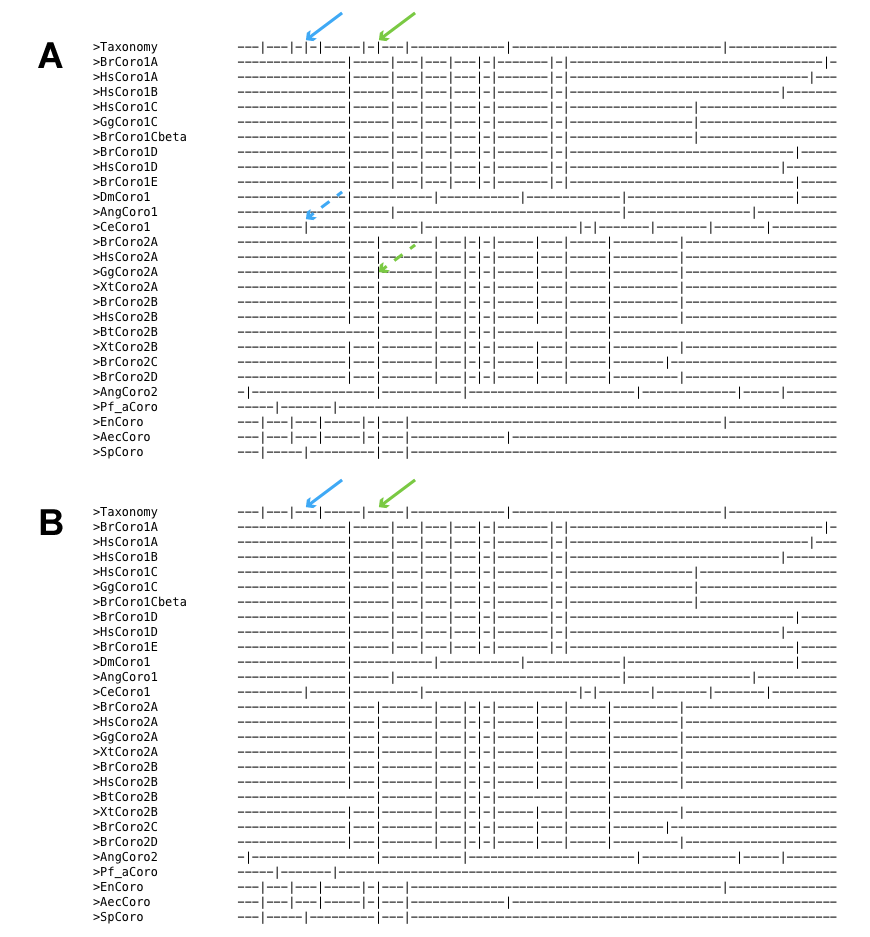
Figure 7 A) Introns common to fungi are included in the bottom-most exon-intron pattern. B) Only those introns, that are exclusive for fungi, are included in the bottom-most exon-intron pattern.
The parameter --introns-per-taxon creates an additional exon-intron pattern of all taxa with assigned introns. The file extension is -taxonomy (Figure 8).
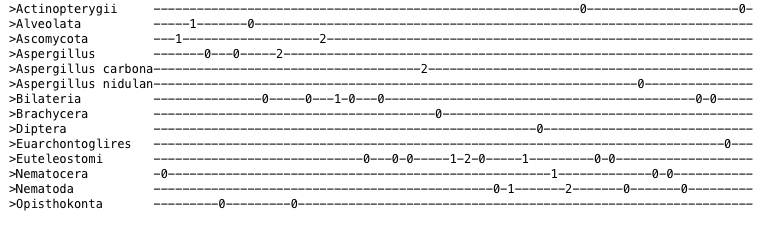
Figure 8 A) Each intron is assigned to the last common ancestor of those species it occurs in. The introns are then combined to exon-intron patterns for each taxon.
Plotting intron gain and loss patterns onto a phylogentic tree
Specifying parameter --tree in combination with taxonomy options --taxonomy and --taxonomy-to-fasta reconstructs a phylogenetic tree of the species analysed. Taxonomic relations of the species named in --taxonomy-to-fasta as defined by NCBI taxonomy or the user-provided species list are converted to a phylogenetic tree (in newick file format) and printed in an additional SVG file. The python script phb2svg.py does the conversion of newick tree to SVG. To use the--tree option, the python interpreter needs to be in the executable path.
The generated phylogenetic tree focuses on gains and losses of intron positions. The generated tree file can be viewed using standard tree viewer software. Branch labels contain the branch name and the number of intron positions that were gained (first number) and lost (second number) at the respective node. Leafs are annotated with the number of intron positions occurring in that taxon (first number) and the number of genes analysed (second number). If introns were gained or lost in a leaf, these numbers are included in the leaf name (separated by an underscore). In addition, an SVG representation of the tree is generated (Figure 9). In the SVG file, branches are annotated with taxon name (written above the branch) and number of intron losses and gains (coloured in red and green, respectively).
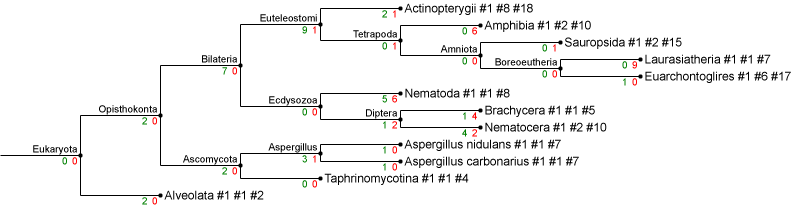
Figure 9 Phylogenetic tree of those branches, at which introns were lost (coloured red) or gained (coloured in green). The numbers displayed behind the species comprise the total number of genes (first number) and intron positions present in these genes (second number).
| Statistics | Back to top |
Detailed statistics about each intron position are obtained by using the --statistics option. These statistics include the total number of introns at each position as well as the last common ancestor of all species harbouring the respective intron. In addition, the distribution of intron counts onto direct descendants of that last common ancestor is given. In the example, only intron positions occurring in human coronin genes were included in the figure (Figure 10).
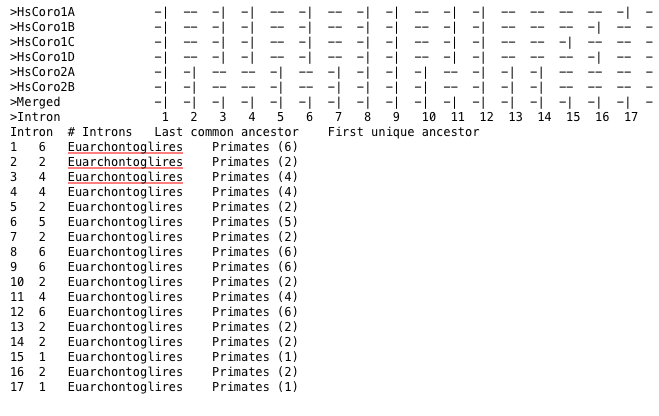
Figure 10 Statistics per intron position, including the last common ancestor of all species encoding that intron.