Web Interface
Contents
- General
- Data upload and display in data center
- Options and submission
- Generating gene structures on the fly
- Aligned gene structures
- Phylogenetic Distribution of Intron Positions
- Browser Support
| General | Back to top |
The web interface makes GenePainter easily accessible. It guides you through data collection process and provides a comprehensive overview of data GenePainter will use. It does not, however, provide all of the many options GenePainter has to offer.
| Data upload and display in data center | Back to top |
Data upload starts with the input or upload of a multiple sequence protein alignment. Upon that, all other file upload handlers will be enabled.
FASTA headers are listed as "Gene names" in Data Center. All uploaded data will be associated with the gene names and displayed in Data Center. For the gene structures, the association will be drawn based on file names of uploaded gene structure files. Species names are linked to gene names either manually or through the uploaded map.
GenePainter will analyse all genes with an aligned sequence and a gene structure. In order to exclude some genes from the analysis, please deselect the corresponding "Analyse" checkbox.
| Options and submission | Back to top |
Data submission will start the analysis. If necessary, missing gene structures will be generated. After that, GenePainter is executed. Since GenePainter requires an alignment and gene structures as input, the submit button is disabled until all input is provided.
GenePainter is executed with standard parameters. Apart from that, few options can be set. These include "fuzzy" option and, if a PDB file was uploaded, PDB options. The fuzzy option determines the number of base pairs, within introns are aligned. PDB options specify which intron positions should be mapped onto PDB and which sequences to use for the underlying alignment.
| Generating gene structures on the fly | Back to top |
An alternative to gene structure upload is the generation of gene structures before the actual GenePainter execution. To this end, you need to provide a species mapping and select the "Generate gene structure" checkbox for each gene for which the gene structure should be generated.
We discourage the use of this feature, however. Reasons are, that GenePainter itself is reasonably fast. The generation of gene structures through WebScipio API will slow the analysis remarkably down. The WebScipio web interface on the other hand is faster than the API. Thus, if you generate gene structures yourself and uploading the, you will benefit from:
- The full range of options Scipio has to offer (the API will be queried using default parameters)
- A fast and convenient way to generate, view and download your gene structures
| Aligned gene structures | Back to top |
GenePainter provides different formats for viewing the aligned gene structures. They are pre-processed and grouped into result tabs.
Intron Alignment
The intron alignment is the basic output format of GenePainter. A merged pattern, featuring all intron position, is displayed underneath the exon-intron patterns of individual genes. Intron positions in the merged pattern are colored by their conservation. Dark red corresponds to a highly conserved position, dark blue to a weakly conserved position. Coloring can be applied to exon-intron patterns by selecting the "Highlight common introns" checkbox. Selecting the "Highlight unique introns" checkbox colors those intron positions that are unique to a single gene. Introns within N base pairs are highlighed by selecting the "Highlight fuzzy introns" checkbox. In order to merged those introns, select the "Show fuzzy introns merged" checkbox.
The default marker for introns is "|". Alternatively, a number indicating the intron phase can be used as marker. To this end, select the "Show intron phase" checkbox.
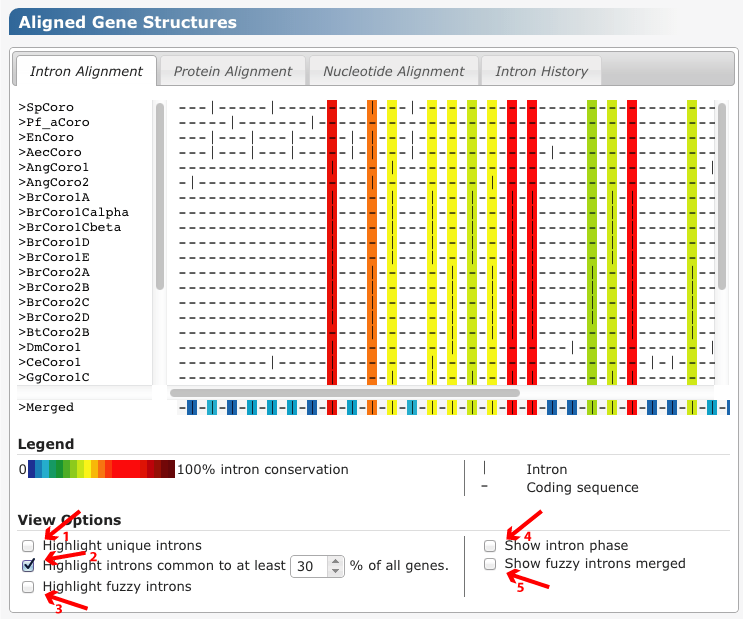
Figure 1 Different options for viewing the intron alignment are marked in red. 1) "Highlight unique introns" checkbox, 2) "Highlight common introns" checkbox with input field to specify the conservation threshold, 3) "Highlight fuzzy introns", 4) "Show intron phase", 5) "Show fuzzy introns merged".
Alignment
Intron positions are incorporated into the uploaded multiple sequence alignment. Intron phases are included as additional lines in the alignment. Common alignment gaps are removed. Per drag and drop, you can move to different positions in the alignment.
Nucleotide Alignment
Two different graphical representations of then nucleotide alignment exist. In each format, common introns are drawn underneath each other. While exons and introns are both drawn to scale in the standard format, intron length is fixed in the reduced format. You can switch between both formats by selecting "Standard" or "Focus on common introns".
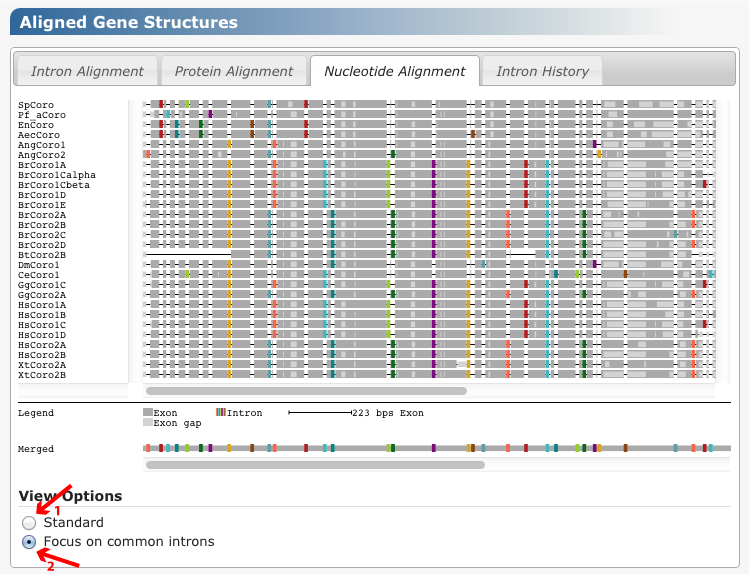
Figure 2 Different formats for viewing the nucleotide alignment are marked in red. 1) "Standard format" checkbox, 2) "Focus on common introns".
Intron History
The intron history lists statistical information as the total number of introns at each intron position as well as the taxonomic distribution of intron positions. The latter is only given, if species information was provided for individual genes. The taxonomic distribution of intron positions include the last common ancestor of all species harbouring the respective intron as well as the distribution of intron counts onto direct descendants of that last common ancestor.
| Phylogenetic Distribution of Intron Positions | Back to top |
The phylogenetic distribution of intron positions can be only displayed if species mapping was provided for at least two of the analysed species.
GenePainter plots intron gain and loss events onto the NCBI phylogeny using a maximum parsimony approach. Introns shared by the genes of two species are regarded as already been present in their last common ancestor and are marked as intron gain events there. If species of sub-branches miss the respective intron, an intron-loss event is marked for this branch.
Intron gain and loss events are plotted in green and red, respectively, onto branches. All introns present in a given taxon, or those introns that were gained by the given taxon can be highlighted in the "Intron Alignment", "Nucleotide Alignment" and "Intron History" tabs above. To this end, please select a taxon in the phylogenetic tree. The aligned gene structure views are automatically focused onto the first highlighted intron position. Please scroll through gene structures and tables in order to see all highlighted introns.
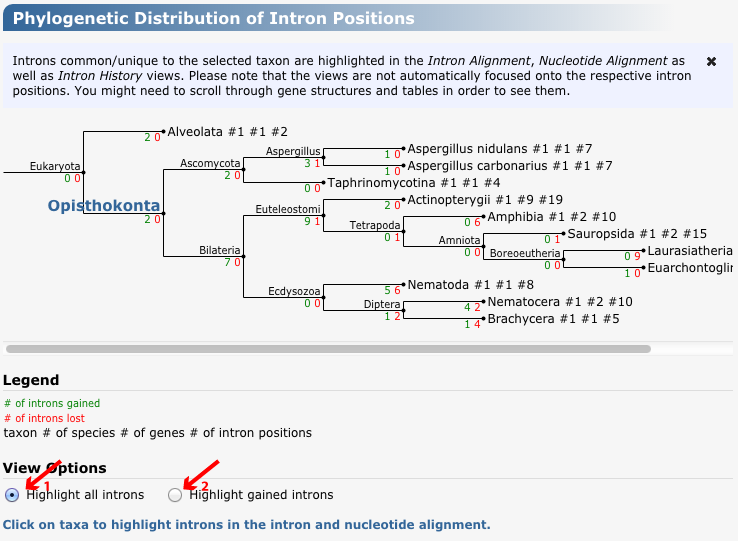
Figure 3 Phylogenetic tree of those branches, at which introns were lost (coloured red) or gained (coloured in green). The numbers displayed behind the species comprise the total number of genes (first number) and intron positions present in these genes (second number).
Different formats for highlighting introns in the "Intron Alignment", "Nucleotide Alignment" and "Intron History" tabs above are marked in red. 1) "Highlight all introns", 2) "Highlight gained introns". Taxon "Ophisthokonta" is selected.
| Browser Support | Back to top |
We optimized the GenePainter web application for Firefox and Google Chrome. Additionally, Safari and Internet Explorer 11 are supported. The application’s functionality might be reduced in other browsers, and in older versions of the Internet Explorer.