Analysis Strategies
Contents
- General
- Analysing All Data, Visualizing All Data
- Analysing All Data, Visualizing a Subset
- Analysing a Subset, Visualizing a Subset
| General | Back to top |
GenePainter includes all genes in its analysis, for which both an aligned protein sequence and the gene structure are present. Assuming that the multiple sequence alignment contains all sequences of the dataset, the easiest way to analyse only a subset of all data is to copy the corresponding gene structure files to a new folder and specify that folder. A more elegant way to accomplish this task is to use the various data and output selection options GenePainter offers.
Subsets of data for analyse and visualization can be specified in various ways:
- A list of gene names corresponding to gene structure file names and fasta headers in the multiple sequence alignment (option --selection-based-on-list).
- Specifying a species name by using option --selection-based-on-species. This option is only possible together with --taxonomy-to-fasta to correctly associate genes with the selected species.
- A regular expression, which is then applied on gene names (option --selection-based-on-regex). The regular expression needs to be enclosed by quotation marks and specify only the regular expression itself, not the surrounding ("/"). Modifiers such as "i" (for case insensitivity) are not allowed. The validity of the regular expression can be checked on online platforms such as rubular.
| Analysing All Data, Visualizing All Data | Back to top |
This is the default. However, you can also explicitly set --analyse-all-output-all.
| Analysing All Data, Visualizing a Subset | Back to top |
For many purposes it is useful to focus the visualization on a specific subset of the data while all data is analysed. This is done by setting --analyse-all-output-selection. For --analyse-all-output-selection, the complete dataset, i.e. introns occurring in all data, is analysed, but only gene structures of selected data are included in the output. For example, the dataset contains hundreds of genes from species all across the eukaryotic tree of life. Here, it might be better to focus the visualization on only the human or mammalian genes.
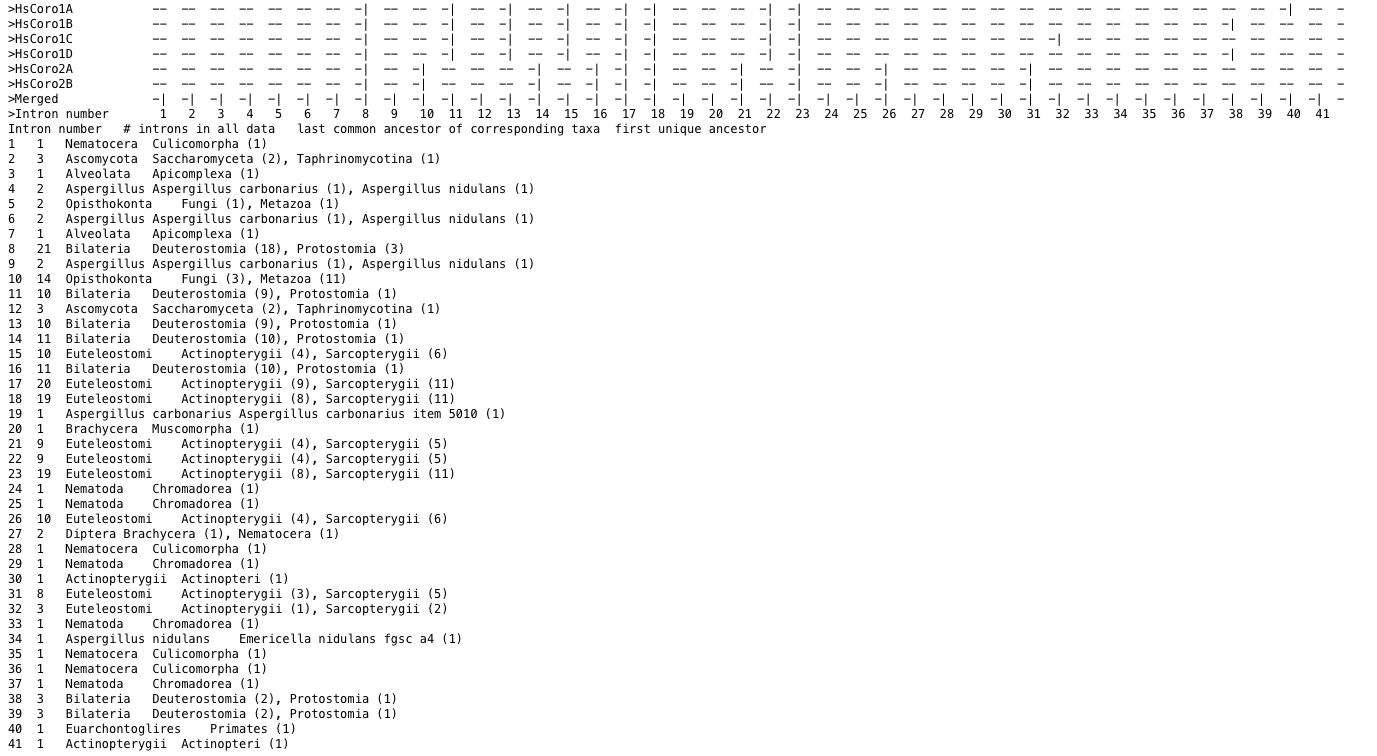
Figure 1 Statistics for intron positions occuring in the complete dataset (lower part). Only those intron positions occuring in the human dataset will be included in exon-intron patterns (upper part).
| Analysing a Subset, Visualizing a Subset | Back to top |
In might be important to focus the analysis on the introns of a single species or a subset of species. For example, it might be interesting to analyse the evolution of the introns present in certain human genes, while the introns conserved in plants but not present in humans should be ignored. In this case, only the conservation of the introns present in this selection will be determined and visualized (option --analyse-selection-on-all-data-output-selection).
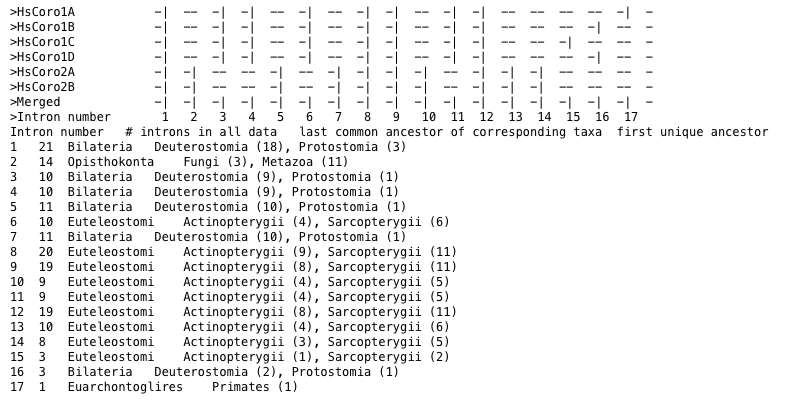
Figure 2 Statistics for intron position occuring in human coronin genes. Statistics correspond to all data.
To analyse and visualize only a selection of the data, use --analyse-selection-output-selection.
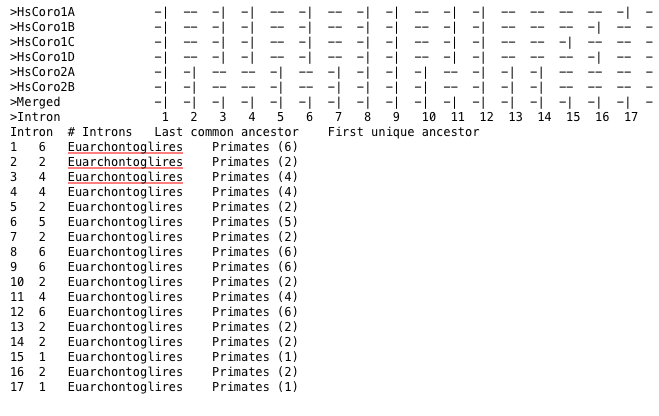
Figure 3 Statistics for intron position occuring in human coronin genes.